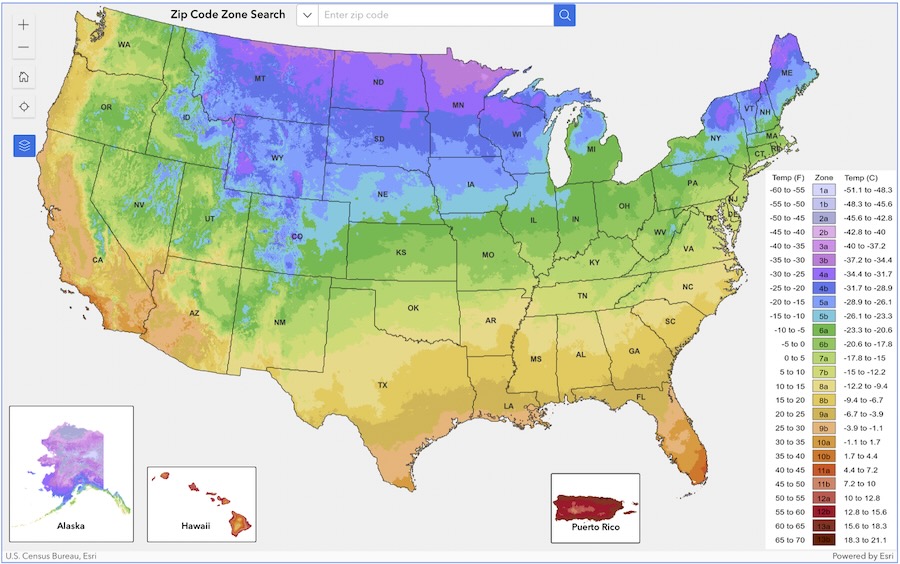
YOU NO DOUBT have seen news that the USDA Plant Hardiness Zone Map was just updated, and that half the country once again got reclassified a half-zone warmer just as many of us did after the previous update of the map in 2012. But what does it all mean to gardeners, practically speaking?
Todd Rounsaville is a USDA horticulturist and research scientist who was involved in the years-long project that led to the creation of the new map. He helped me drill into what it reveals and to other factors affecting plant hardiness.
Todd leads the U.S. National Arboretum Germplasm program, and he acted as chairman of the technical review team for the 2023 USDA Plant Hardiness Zone Map, a group of about 40 people across the country.
Read along as you listen to the Dec. 11, 2023 edition of my public-radio show and podcast using the player below. You can subscribe to all future editions on Apple Podcasts (iTunes) or Spotify (and browse my archive of podcasts here).
 2023 hardiness zone map, with todd rounsaville
Margaret Roach: Thanks for making time today, Todd, and it must feel good to see the multi-year effort come to fruition.
Todd Rounsaville: Thanks for having me. And yes, it’s nice to have this out and released to the public and very rewarding to see very positive comments coming in about both the utility of the map and also that gardeners are saying that it’s matched what they’ve seen in their landscape. That’s nice for that confirmation.
Margaret: I think reading some historical papers and so forth that you sent me to do a little homework before our conversation, I read I think that the first attempts that this kind of mapping were in like 1927. It’s a long tradition trying to figure out what’s going on out there [laughter].
Todd: Going back to that era and the number of plants that were being introduced into the states from temperate regions of the world, it was important to understand what would survive where, because latitude is often a good indicator, but there are other factors involved of course. And what these various iterations have found over the years and has kept the tradition going with using this what we now call the Plant Hardiness Statistic, which is the cold temperature, the extreme cold being a really helpful predictive indicator about plant survival, perennial plant survival.
Margaret: What zone are you in; where do you live and garden? You’re near Beltsville, Md., or where are you?
Todd: I live and garden in the PG County [Prince George’s], Maryland, which is just outside of D.C. The arboretum, the National Arboretum, is in D.C. and that was a zone 7B, and the arboretum is now zone 8A.
Margaret: I moved to 6A. In 2012, I moved to 5B. Because I’ve been in the same garden for decades, I’ve seen it go a whole zone so far [laughter]. And this new map, the 2023 map, utilizes data from 1991 to 2020, I think, so like a 30-year span, is that correct?
Todd: That’s correct.
Margaret: And you just said before what the data point that it looks at. Tell us just briefly about that, and a little bit about why this one is so different from… How did half the country shift? Because the easy thing for us all to say as amateurs is, “Of course; global warming.” But that’s not the story; that’s not what this is all about exactly.
Todd: That’s a great question, and I think there’s a simplicity to how the map is generated, but it’s not always intuitive, just glancing at the zone. I think understanding that is really helpful to inform people that rely on it exactly what it means—what’s potentially changed or not. And again, the Plant Hardiness Statistic is a single data point per year, and that is the coldest temperature recorded on the coldest night. And then the map is generated by taking that data point and averaging it over 30 years.
And as you said, for this version of the map, the years range from 1991 through 2020, this map comes about 10 years after the previous map, but we’re actually using about 15 years’ worth of new data, because I think the 2012 map ran up to 2005 data. And not only are we using new data, those new 15 years, but we also lose the 15 years of averages that began for the last map in the mid-seventies and eighties. There was another part to your question; that was a long one.
Margaret: It’s O.K. And it’s data from more weather stations than in the 2012 map also. Isn’t that correct?
Todd: That is correct. There were about 68 percent increase in the available weather stations for this version of the map, had a lot of new data points and also some of the weather stations that were used during the last iteration or actually were not used, because they existed but they didn’t have enough data; they didn’t go back 30 years. And I think that’s part of the reason why so many more were available for this iteration.
Margaret: And there’s been a lot of technology advancements in our ability to map and these experts’ ability to map as well. The maps are more, I don’t even know what the word is [laughter]. It is just so much more sophisticated, isn’t it? The detail that can be… I’ve watched and read some reactions of people on social media and elsewhere where they’re talking about how they can see where a mile away from them, maybe because of a change of elevation or whatever, where there’s a different zone. There’s a lot more detail it seems like.
Todd: That’s an important note to make. And it’s especially true if you scan the map and you look into areas that have greater changes in topography, some of the mountainous areas, you’ll see that there’s a lot of variation. And that’s useful by using the map online and being able to zoom in and really note that some of the topographic changes can really influence even within the county level. You may span three or more half zones; there are lower elevation pockets where cold air settles.
And I think some people may live and garden in those areas and their personal observations over time may have confirmed that they were in one of those frost bottoms. But for potential growers that might be wanting to start a new operation, or a new homeowner that’s moved to an area, looking at that more fine-scale data, the resolution on the map can help inform how your local site compares to the surrounding area.
Margaret: You shared with me a video, a YouTube video actually, from a man called Gardener Scott I believe. It’s a great video. Thank you for sharing it. He’s a YouTube person, and he does a demo of how we can utilize the map and some of its features that it would be hard for us to explain here just in words aloud [laughter]. But there’s a lot of enhancements from the previous time, including this much more granular, getting down to almost like half-mile increments that we can see our zone. And as you say, in a county, there may be multiple zones because of changes in the topography and so forth.
It’s very, very interesting, but it’s not the only thing that affects what we can grow [laughter].
I think Tony Avent or someone at Plant Delights Nursery posted on social media the other day about they’ve tracked their winter lows over the same 30-year period or whatever, and that they would have, if they went by the zones, by the current map at each time, they would have lost plants in a certain number of those years. Because again, it’s only one data point, and plants are vulnerable to lots of things.
I guess I wanted to know, because you have a lot of expertise, what do you think about about hardiness? Because it’s not just that one average low number, is it?
Todd: That’s right. That’s a great point. What I think gardeners know, and certainly Tony Avent knows, is that within whatever zone you are, that there are the influence of environmental, biotic variables that can greatly modify a plant’s ability to survive throughout the year and certainly during the winter. And in the winter months, there’s a lot of plants that the cold is an important factor, but so is as, one example, soil moisture. Keeping things drier, they can often have more cold hardiness; some desert plants would be one example.
And in terms of gardeners who may have seen a shift by a half zone, maybe even a full zone, our general advice hasn’t been to go out and reevaluate your landscape, think about removing things and planting new things because you’re warmer. One part of that is understanding your very local conditions, the microsite of your garden, and factors like if you’re growing plants on the north side of your house versus the south side. In the winter, the south side will get more sunlight so things can have some reflective heat and potentially be buffered a little bit and have a better chance.
Margaret: I’m thinking of exactly those types of things, almost like reading microclimates, and whether they’re opportunities, or like “uh-oh, uh-oh,” they’re warnings.
Todd: Of course it is species dependent, but in my own gardening experience, I think that taking advantage of your microsite and those things like working with the drainage you have or the sun exposure you have can shift certainly more than a half zone. You can get away with things that may not be rated for your zone or would be rated marginally.
Margaret: For instance, I know that you have particular interest in or involved in a research project that includes native Magnolia species. And magnolias are a beloved garden plant. And I used to be in zone five…[laughter] was I? I guess I was 5A then 5B now I’m 6A. And even there, if I were to have picked an early blooming Magnolia and put it against near to a wall on the south side of my house where it woke up “early,” where those buds, I would’ve had them blasted every year practically and never had flowers.And if I put it somewhere where it could wake up a little later, I could do really well with it. [Above, an early awakening Magnolia ‘Elizabeth’ zapped by a frost in late March.]
That’s an oversimplification, but that’s what we’re looking for as gardeners, I think. And again, to avoid those wet feet at all costs, like you said in winter, that’s a sure killer of a lot of things.
Todd: Exactly.
Margaret: When I began gardening, zone pushing or zone denial as some people call it [laughter], was the ethic I was raised on. Because there were all these new catalogs and people like Plant Delights Nursery or the former Heronswood Nursery or so forth, and you could get all these things that were practically just being put, or were just being put, into the marketplace—and in small numbers and so forth. And there wasn’t a lot of data about those plants, and where they were hardy to exactly; not much was known except where they came from, where the explorer had found them.
It’s like we tried things and it’s O.K. to do that, but you have to be aware that you may have losses, yes? It’s not a sure thing to say, “Yeah, I can grow zone 6.” I can’t just go out right now and say “I can grow zone 6 plants.
On the other hand, a friend at Broken Arrow Nursery in Connecticut dared me a couple of years ago to—again, another magnolia—because I love big leaves, he dared me to plant the big leaf magnolia, was is Magnolia macrophylla? I have this waist-high plant, and now I feel validated. Now I am a zone 6, and that’s supposed to be a zone 6 plant, but it’s been very happy even when I was officially a 5B [laughter].
Todd: And along those lines, it’s also good to note what a volatile statistic these data points are, because it is a single data point. Folks may be in the same zone, or they may have increased, say, a half zone, But there’s really no predicting that the next winter or a winter in the near future could be more indicative of a colder zone, and a really extreme cold snap could kill a lot of plants that had done well for a few years, and that’s why we take 30 years of data into account for the average.
Margaret: And the other thing that I worry about more in recent years, as we’ve seen shifts and changes and even our familiar—if we’re in a garden for a long time—our familiar garden patterns seem different. I also wonder, especially with woody plants, how well-prepared they are, how much chance they’ve had to harden off, so to speak.
We don’t have, where I am, few gentle early frosts anymore that say, “Hey, it’s coming, watch out everybody.” [Laughter.] We will have a hard freeze as our first frost a lot of times now it’ll be dramatic, will be very early. And then there’s balmy weather as we’re having now this year. And I wonder how prepared the plants are. Is the hardening off thing, is that also being affected, and are they more vulnerable in many regions because of the change in the so-called fall time?
Todd: I think you bring up a good point, which is that there are many ways that cold temperatures can negatively affect plants. You just mentioned some of those early freezes, and with Magnolia you talked about some of the later freezes as they’re waking up. Although the Plant Hardiness Zone Statistic, really it does not take those factors into account. It’s the third major class of cold damage, which is those extreme lows generally occurring in mid-winter when things are fairly well dormant.
Although this map doesn’t take into account—it’s a single variable—just like you said when we opened up about some of the broader changes we’re seeing with the global climate… Although the Plant Hardiness Zone Map doesn’t take any of that into account, all of it’s connected: The so-called heat index, the number of days that temperatures are above 30 centigrade or 86 Fahrenheit, plays a role in plant survival, as to do some of these early cold spells and the variability of temperatures, the fluctuations during the winter. And doing a multivariate assessment similar to what Canada does, although it’s not part of this map, it’s important to really take all of those things into consideration and think of the Plant Hardiness Zone Map as one of the tools in the gardener’s toolbox, as a vehicle for risk assessment into the future.
Margaret: I like that, that you’re saying “as a vehicle for risk assessment,” because again, it’s not a guarantee kind of thing. It’s not like, “Sure you can.” It’s not like if you go and get your size in a particular garment [laughter], if you reorder that garment, it will be the same size will fit you again. It’s not like that. It’s not like that because as you say, there can be these aberrant times.
And I think for gardeners, I know I do it, I think we conflate or confuse weather and climate, factors of weather and climate, and maybe we should explain the difference between the two from your point of view, because I feel like I get attached to the weather, and that’s not the bigger picture, either.
Todd: I think that’s easy to do as gardeners. Where personally, for example, something I do every day is just check precipitation and it changes my daily plans, and what’s happening in the immediate future that I need to potentially prepare for. But also as gardeners, it’s important to think about the longevity of plants in the landscape and the longer-term impacts of their survival and health. And I think that’s the climate portion.
It’s why we use these 30-year averages in building this map and try to—especially for planting trees—30 years tends to be across all plants, potentially an average lifespan if you factor in herbaceous perennials. But with tree planting, I think most of us plant them with the expectation that they’ll outlive us, and we want to make sure that we’ve appropriately sited them both in their growing conditions in terms of soils and moisture, but also that we’ve picked appropriate species and provenance material that can last for a long time based on broader changes, climate changes, global temperature, variables like that.
Margaret: When you’ve watched the coverage of the release of the new map, and been interviewed yourself and asked about it yourself, what are the things that you want to get across most of all to people from the new map?
Todd: A typical question from the gardening community relates to, as you mentioned about half the country shifted into a warmer half zone, folks are asking, “What does that mean for me?” And we talked about earlier exactly what the Plant Hardiness Statistic is, and one of the map downloads on the Plant Hardiness Zone Map website is what we call the change map. And it just shows by half zone the parts of the country that have shifted to one half zone, two half zones, up or down. And what you’ll see is some fairly obvious bands that run parallel to the zones, but shifted a little bit.
And what I’m getting at is that if you were previously on just the edge of a half zone, you could have had a very small change in this 30-year average that pushed you into the new zone. Or if you were on the lower edge, a nearly 5-degree change would have kept you in the same zone.
Again, we’re really not suggesting any major changes to how folks are gardening, but to take in the broader pattern across the country, which is that there was a slight increase in the extreme cold temperature. And we would expect that future iterations of this map that we would see all of the zones creeping northward; that is correlated to the more global scale changes that we’re seeing.
That’s really the takeaway. Things have changed, but the change has been minimal and to not make major changes to your landscape based on it.
The other thing I like to point out to people is that along with the new map, the actual website has been completely redesigned. There’s some really great information there, not just about some of the technical information about how the map was created and some of the changes that we saw, but there’s some terrific resources there that are really aimed at any user of the map. And they range from some of the more practical information for folks that might be getting into gardening about soil health, or how to manage weeds in the landscape. And then it goes on to also feature some of the work that’s being done across ARS [Agricultural Research Service], across the country by different ARS researchers whose work intersects not just with plants, but with again, soil health, insects and diseases, anything that has a relation to the Plant Hardiness Zones.
Margaret: I am glad you brought that up. The other thing that I’ve definitely noticed… I’m a birder, and so over the last decade or more I’ve noticed there’s changes in ranges of birds, for instance; I see birds I didn’t see here 20 or 30 years ago and so on. And that’s true also of pests and even certain types of diseases in a sense, that they can expand their territories as well. They’re recognizing the opportunity as well that there’s a longer season, or a milder climate, a little farther up and a little farther up and a little farther up the map [laughter]. Gardeners are also contending with that, yes?
Todd: That’s true. And I would say it works both ways. There are animals and microorganisms that may increase their range during warmer winters. It opens up habitat, but by the same token, I think especially with some of the insects and microorganisms that they do need cold sometimes to complete their lifecycle and get the chilling that they require. I think that would vary species to species, but things are very synced up with temperature for lifecycle, it does make a difference.
Margaret: Todd Rounsaville from USDA, I’m fascinated, and I’m so glad you can make the time today to explain this to the listeners and to me a little bit more. And actually, I hope I’ll talk to you about native magnolias again soon because something really interesting. Thank you for being here today.
Todd: My pleasure. Thanks for having me. And I would love to talk about Magnolias anytime.
Margaret: Absolutely. Good, it’s a date.
more about hardiness zones
prefer the podcast version of the show?

 2023 hardiness zone map, with todd rounsaville

